Flu
Scenario Modeling Hub
A Note on Scenario Modeling Hub Round 1 of 2025-2026 (Posted October 29, 2025, Revised Dec 10,2025)
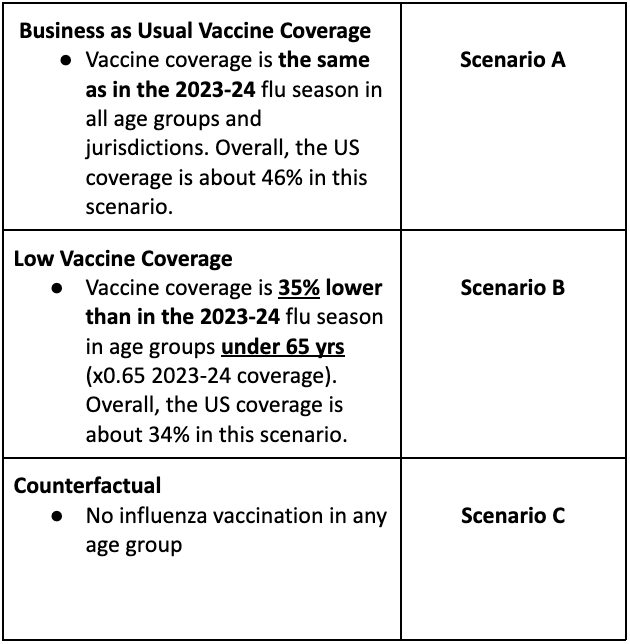
In the first influenza round of the 2025-26 season, the Scenario Modeling Hub generated pre-season projections for the 43-week period from Sunday, Aug 10, 2025 to Saturday, June 6, 2026. We considered 3 vaccine scenarios representing the impact of different levels of vaccine coverage (a "business-as-usual” scenario assuming 46% all-age vaccine coverage, as in the 2023-24 season; a pessimistic scenario assuming 34% all-age vaccine coverage based on a putative 35% decline in vaccine uptake in individuals under 65 yrs compared to 2023-24; and a counterfactual representing no vaccine uptake in any age group). Epidemiological uncertainty was left at the discretion of the modeling teams. Ensemble projections are based on contributions from 12 teams (including 11 contributing national projections) using the trimmed linear opinion pool approach.
Our main findings include:
- In both business-as-usual and pessimistic vaccine coverage scenarios, projected influenza activity is likely to remain below levels seen last season. Hospitalizations are projected to peak at 29,000 weekly admissions (95% PI 7,000-66,000), compared to 54,000 last season. Hospitalization peak timing is not well defined, though expected to occur between the weeks of December 28, 2025 and February 1, 2026.
- In the business-as-usual vaccination scenario, cumulative burden for this season is projected to reach 316,000 (95% PI: 94,000-680,000) hospitalizations and 35,000 (95% PI: 14,000-48,000) deaths.
-
Vaccine levels substantially affect hospitalization and death burden:
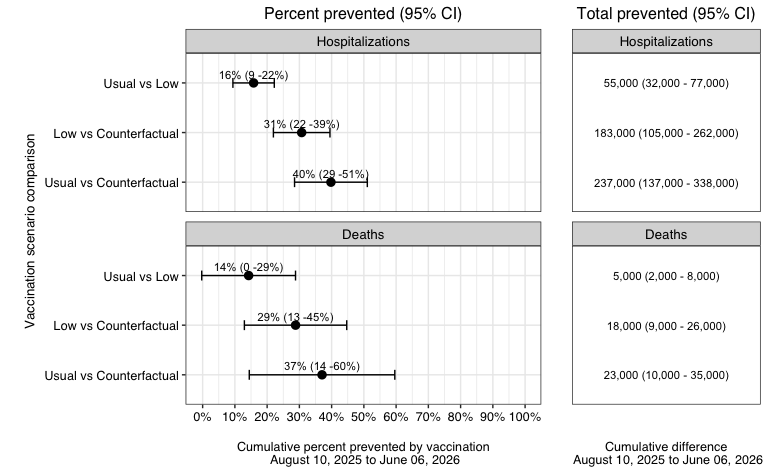
- A business-as-usual vaccination campaign is estimated to prevent 39% (95%CI 28-50%) of influenza-related hospitalizations and 37% (95%CI 14-60%) of influenza-related deaths, compared to no vaccination. In absolute terms, this represents in the order of 240,000 hospitalizations and 23,000 deaths averted (medians).
- A pessimistic vaccine uptake is estimated to prevent 30% (95% CI 21-39%) of hospitalizations and 29% (95%CI 13-45%) of deaths.
- Vaccine benefits vary between states depending on the level of vaccine coverage. For instance, a business-as-usual vaccine campaign is projected to avert a median of 25% (95% CI 15-34%) of hospitalizations in Nevada and 45% (95%CI 25-64%) in the District of Columbia.
- These estimates include the direct and indirect benefits of vaccination, namely, both the benefits to those vaccinated and their contacts who may experience reduced influenza transmission.
- There is considerable variability between models as regards the projected impact of the vaccination program. This variability is explained in part by differences in assumptions about the vaccine effect against infection and model structure.
-
A few caveats are worth noting:
- These are pre-season projections, and hence there is no calibration data on the dynamics of the upcoming epidemic.
- All epidemiological uncertainty was left at the teams’ discretion. This includes the particular mix of influenza subtypes circulating this season, and the transmissibility and severity of circulating strains.
- Estimates of vaccine benefits should be interpreted in light of a high assumed VE against hospitalizations (50%), which anticipates a good match between circulating viruses and vaccine strains. Further, projections assume a high vaccine uptake among individuals over 65 yrs who suffer higher hospitalization and death burden. Lastly, indirect vaccine benefits are theoretically amplified in low influenza transmission seasons and most models project a fair probability of a low transmission season.
- Only 4 models provided death estimates so death projections should be taken with caution.
Fig 1. Hospitalizations and deaths averted by vaccination Estimates averted by contrasting cumulative projections at the end of the season for usual vs low vaccine coverage scenarios (top), low vs counterfactual (middle) and usual vs conterfactual (bottom), for hospitalizations and deaths. Estimates are pair-wise ensemble estimates.

Download an executive summary report for the current Flu round.
Table 1. Flu Scenario Modeling Hub round 1 2025-2026 scenarios. More detailed scenario definitions and model characteristics can be found at https://github.com/midas-network/flu-scenario-modeling-hub.

Rationale
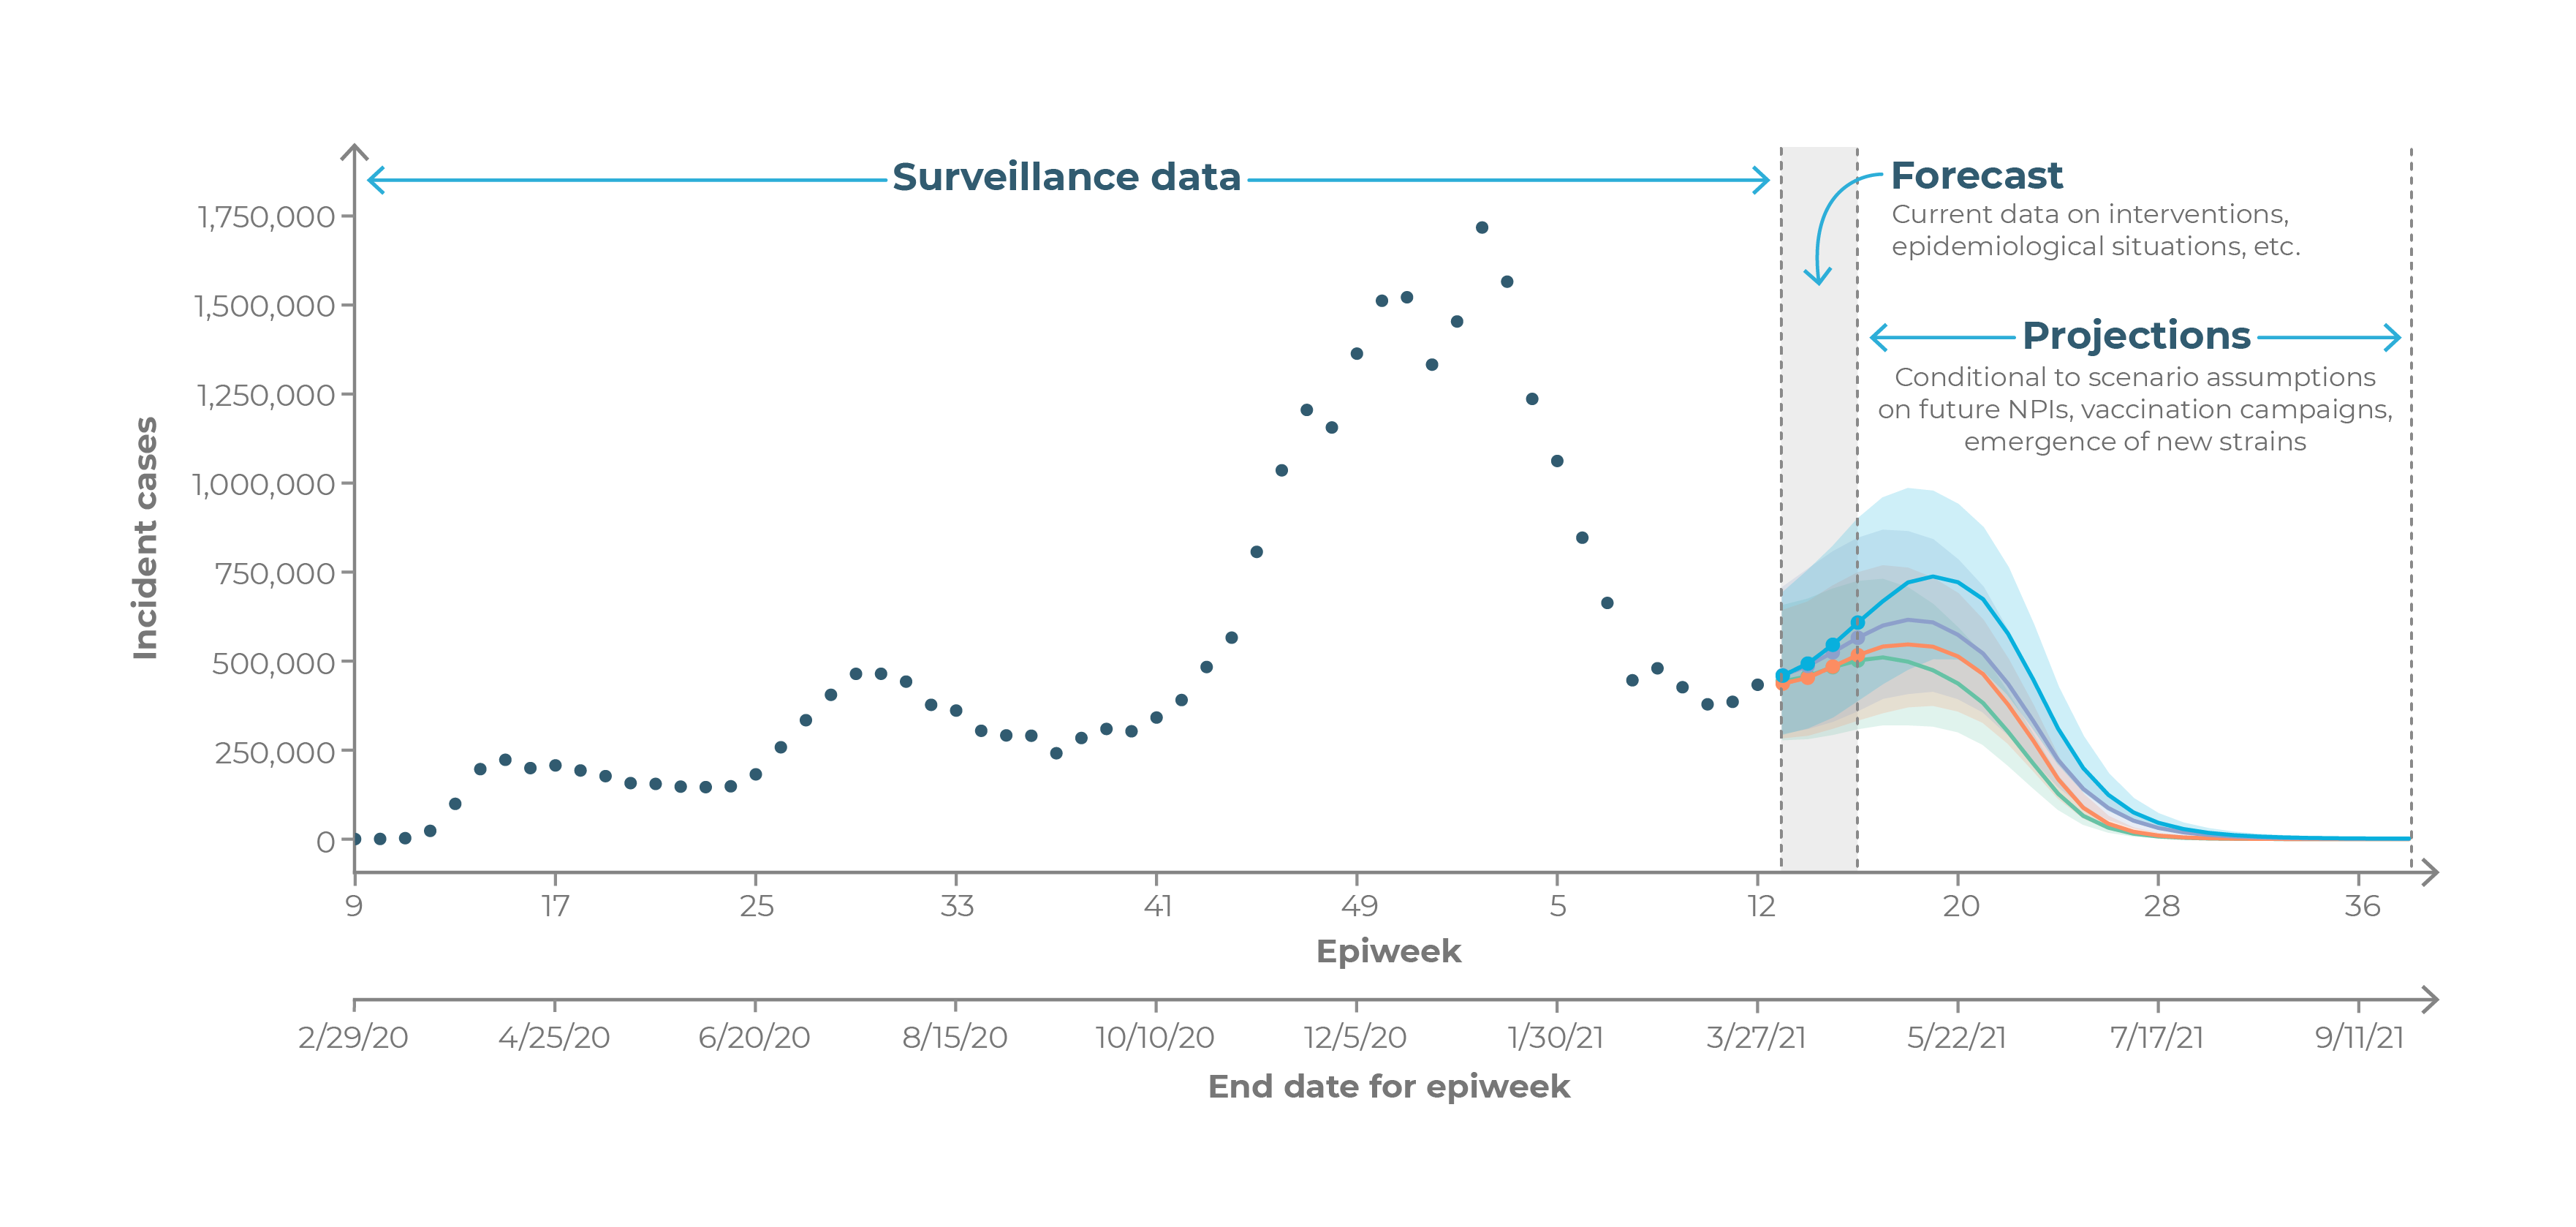
Even the best models of emerging infections struggle to give accurate forecasts at time scales greater than 3-4 weeks due to unpredictable drivers such as a changing policy environment, behavior change, the development of new control measures, and stochastic events. However, policy decisions around the course of emerging infections often require projections in the time frame of months. The goal of long-term projections is to compare outbreak trajectories under different scenarios, as opposed to offering a specific, unconditional estimate of what “will” happen.

As such, long-term projections can guide longer-term decision-making while short-term forecasts are more useful for situational awareness and guiding immediate response.

