A Note on Scenario Modeling Hub Round 1 of 2024-2025 (October 4, 2024)
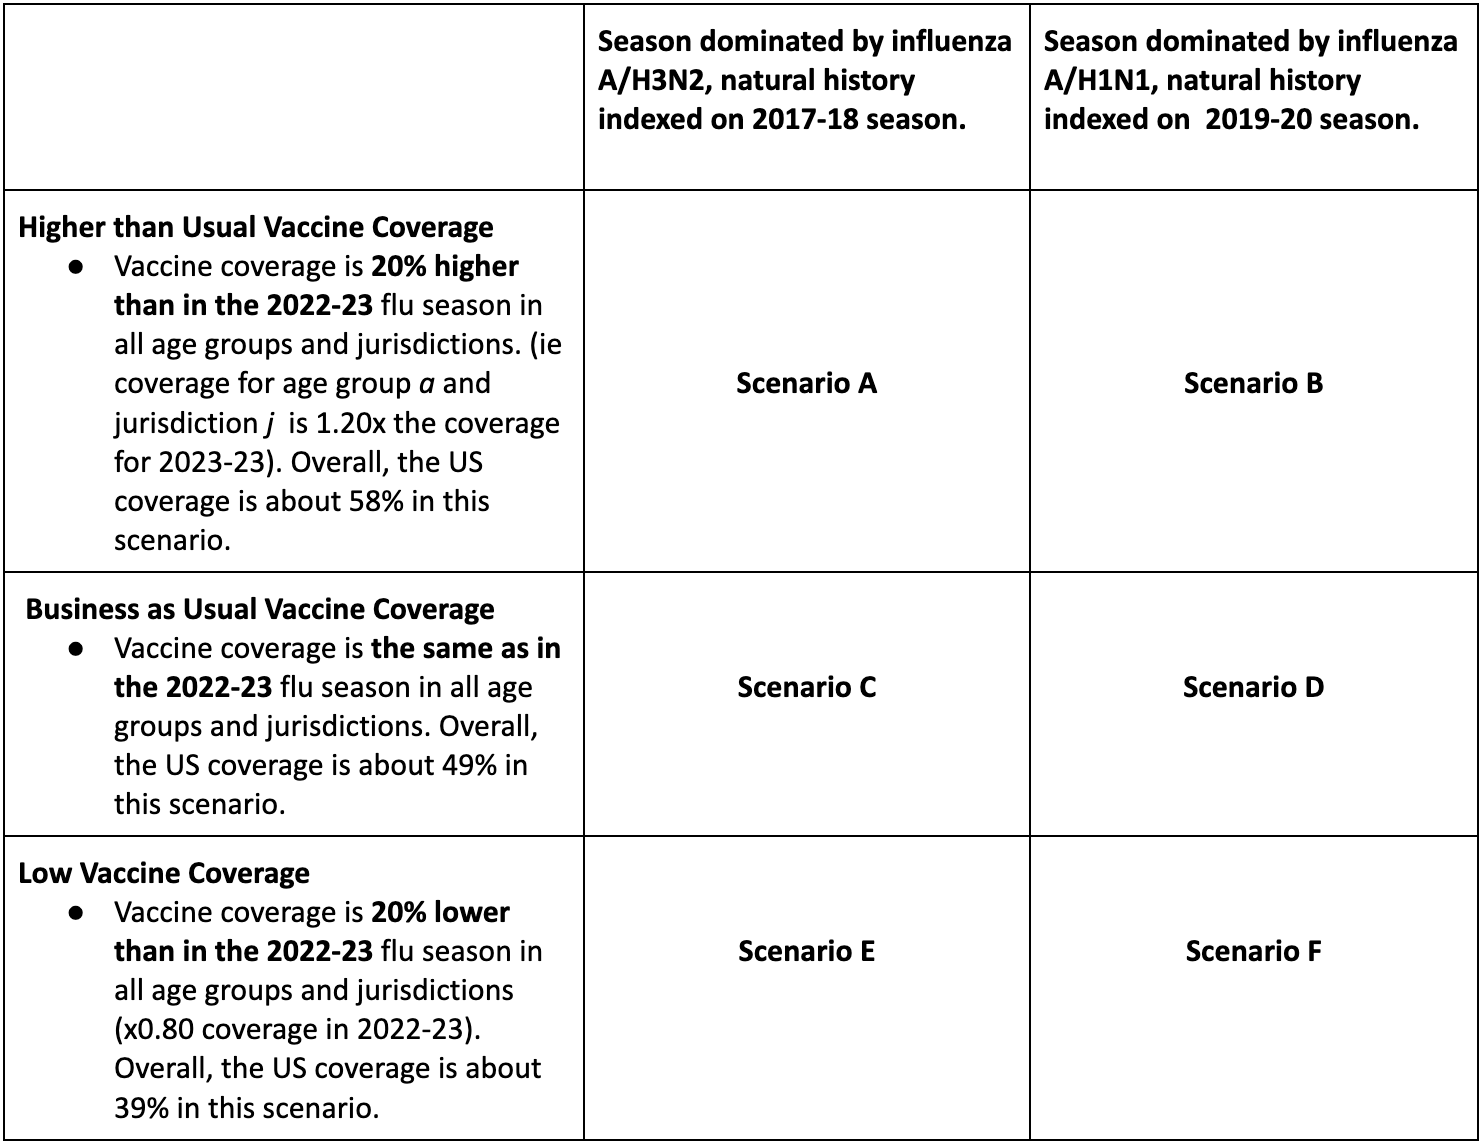
In the first influenza round of the 2024-25 season, the Scenario Modeling Hub generated pre-season projections for the 43-week period from Sunday, Aug 11, 2024 to Saturday, June 7, 2025. We considered 6 scenarios representing the impact of 3 levels of vaccine coverage (20% higher than in the 2022-23 reference season, similar to the reference season, and 20% lower than the reference season), combined with the dominance of the influenza A/H3N2 or A/H1N1 subtype. Ensemble projections are based on contributions from 9 teams (including 8 contributing national projections) using the trimmed linear opinion pool approach.
Our main findings include:
- The dominant subtype will more heavily drive the hospitalization and death burden this influenza season than vaccination: we project an A/H3N2-dominant season would have moderate to high burden of disease compared to a low to moderate burden from a A/H1N1-dominant season, compared to influenza epidemics in the past decade.
-
Vaccination could substantially modify hospitalization
and death burden:
- A 20% relative increase in vaccine coverage compared to usual (58% vs 49% vaccination coverage) would reduce influenza-related hospitalizations by 11% (95% PI: 1-18%; H3N2 scenario) or 12% (2-22%; H1N1 scenario).
- A 20% relative drop in vaccine coverage compared to usual (49% vs 39%) would generate 11-12% increases in influenza-related hospitalizations. In absolute terms, this represents differences in the order of 25,000 to 32,000 hospitalizations (range across medians).
- Projected percent changes in deaths range between 9-14% for a 20% change in vaccine coverage, depending on the scenario, corresponding to differences of 1,400-1,900 influenza-related deaths.
- Median weekly hospitalizations are projected to peak between 18,500 (95% PI: 3,100-54,600) and 37,000 (95% PI: 11,200-101,600), depending on the scenario (most optimistic, scenario B, high vaccine coverage, A/H1N1 dominance vs. most pessimistic, scenario E, low vaccine coverage, H3N2 dominance).
- Cumulative hospitalizations for this season are projected to reach between 223,000 (95% PI: 111,000-443,000) and 395,000 (95% PI: 202,000-836,000), depending on the scenario.
- Cumulative influenza deaths are projected to reach between 24,600 (95% PI: 3,400-34,900) and 42,900 (95% PI: 7,400-96,200), depending on scenario.
- In all scenarios, ensemble projections suggest a prolonged period of high influenza activity between December and February, in part due to differences in projected peak timing across models. Periods of high influenza activity tend to occur earlier in A/H3N2 projections while A/H1N1 projections have more protracted activity lasting into the Spring.
- The combined impact of influenza and COVID-19 on hospitalizations is projected to remain similar to that of last season (2023-24), irrespective of the flu scenario (based on 50% projection intervals). These estimates are based on the assumption of high immune escape for COVID-19, and moderate COVID-19 booster uptake in all age groups (Round 18 scenario A, https://covid19scenariomodelinghub.org/ ).
- There is considerable variability between models as regards projected timing and severity of epidemics, in part due to differences in underlying assumptions regarding seasonality and seeding. This variability is compounded by the absence of early season influenza calibration data.
-
A few caveats are worth noting:
- These are pre-season projections, and hence there is no calibration data on the dynamics of the upcoming epidemic. Further, the NHSN hospitalization dataset was paused in May 2024 so that no recent calibration data was available to the teams.
- Reporting to the NHSN hospitalization dataset is expected to fully resume in November 2024 and may not perfectly mirror prior NHSN data. Hence, there will be no observational data to compare to these influenza projections for September-October 2024, and any change to reporting propensity under the new reporting rules or to influenza testing practices in 2024-25 would affect comparison of our hospitalization projections to data.
- We assumed a fixed VE of 40% against medically attended illnesses in all flu scenarios, which anticipates a good match between circulating viruses and vaccine strains. Assumptions regarding the effects of the vaccine on infection and onward transmission were left at teams’ discretion.
Fig 1. Hospitalizations and deaths averted by vaccination for H3N2 and H1N1 scenarios. Estimates averted by contrasting cumulative projections at the end of the season for high vs usual vaccine coverage scenarios (top) and usual vs low vaccine assumptions (bottom), for hospitalizations (left) and deaths (right). Estimates are pair-wise ensemble estimates.
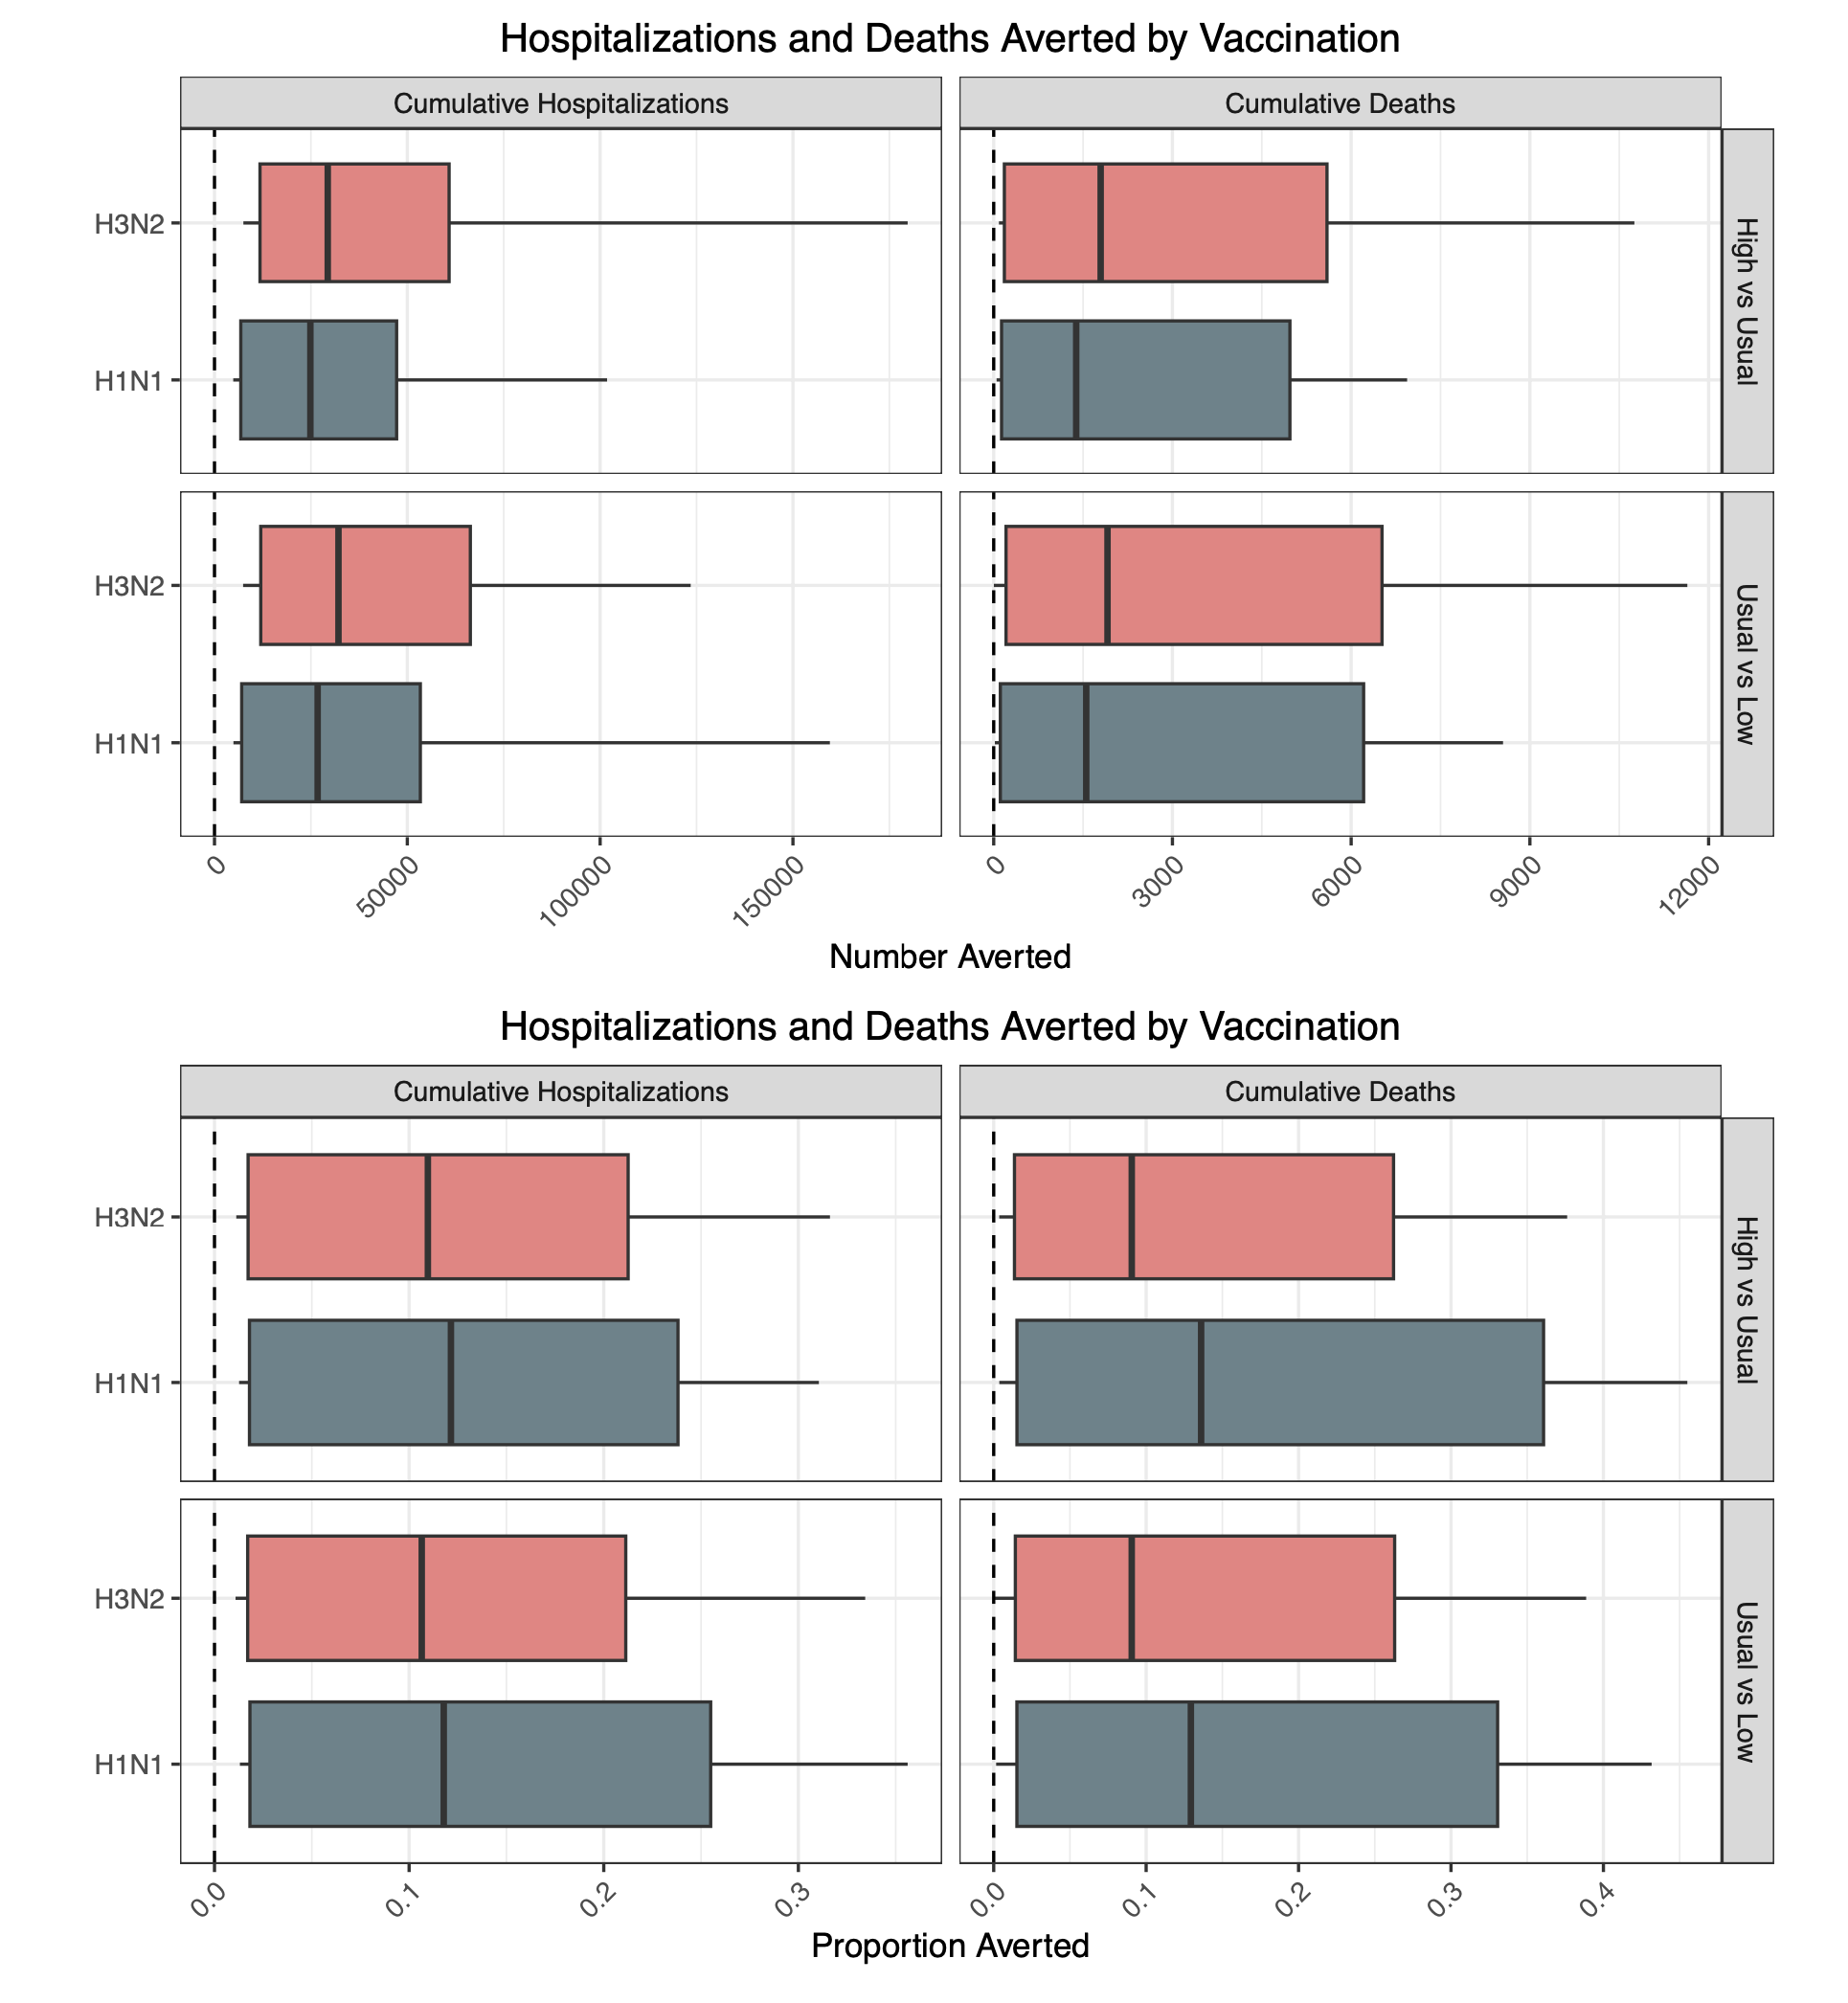
Table 1. Flu Scenario Modeling Hub round 1 2024-2025 scenarios. More detailed scenario definitions and model characteristics can be found at https://github.com/midas-network/flu-scenario-modeling-hub.
A Note on Scenario Modeling Hub Round 1 of 2023-2024 (September 28, 2023)
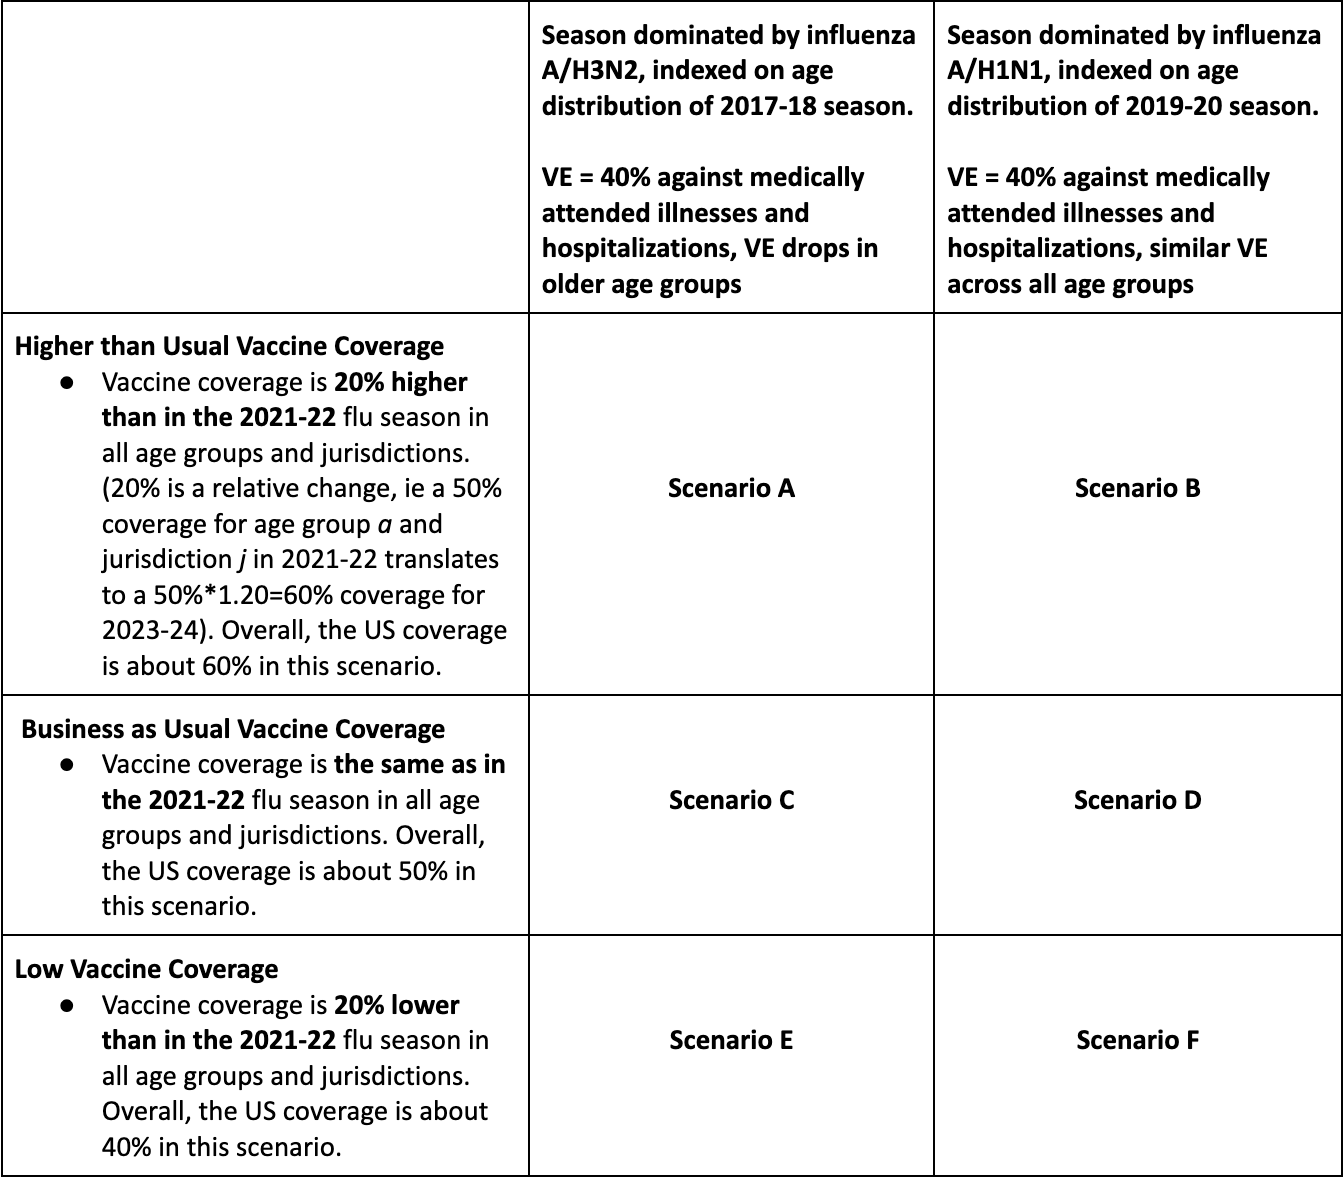
In the first influenza round of 2023-24, we generated pre-season projections for the period Sep 3, 2023 to June 1, 2024. We considered 6 scenarios representing the impact of 3 different levels of vaccine coverage (similar to the 2021-22 season, and 20% higher or lower), combined with the dominance of the influenza A/H3N2 or A/H1N1 subtype. Ensemble projections are based on contributions from 10 teams (including 9 contributing national projections).
Our main findings include:
- The hospitalization and death burden of the next influenza season will be more heavily driven by the dominant subtype than by vaccination coverage, with an A/H3N2-dominant season projected to have moderate to high impact, and A/H1N1 low to moderate impact, compared to influenza epidemics in the past decade.
- In our most optimistic scenario (scenario B, high vaccine coverage, A/H1N1 dominance), median weekly hospitalizations would peak at 10,400 (95%PI 900-22,600). In our most pessimistic scenario (scenario E, low vaccine coverage, A/H3N2 dominance), weekly hospitalizations would peak at 24,100 (95%PI 1,300-41,700).
- In all scenarios, ensemble projections suggest a prolonged period of high influenza activity before and after the New Year, in part due to differences in projected peak timing across models. Periods of high influenza activity tend to occur earlier in A/H3N2 projections while A/H1N1 projections have more protracted activity lasting into the Spring.
- A 20% relative increase in vaccine coverage, compared to usual, would avert 9% (95% CI 3%, 16%) of influenza-related hospitalizations in the A/H3N2 scenario, and 9% (0.5-18%) in the A/H1N1 scenario. A 20% drop in vaccine coverage compared to usual, potentially fueled by a rise in vaccine hesitancy, would increase influenza-related hospitalizations by 10% (95% CI 4-15%) in the A/H3N2 scenario, and 12% (95%CI 5-19%) in the A/H1N1 scenario. Projected percent changes in deaths are less pronounced than in hospitalizations. In absolute terms, this represents differences in the order of 22,000 to 34,000 hospitalizations and 800-1,400 deaths (range across medians).
- Based on median ensemble projections, the combined impact of influenza and COVID-19 on hospitalizations is projected to be lower than that last season (2022-23). This is based on the assumption of high immune escape for COVID-19, and moderate COVID-19 booster uptake in all age groups (Round 17 scenario A, https://covid19scenariomodelinghub.org/). This combined impact is based on the median of both flu and COVID19 scenarios and there is considerable variability within these projections that is not captured by the median.
- A few caveats are worth
noting:
- We assumed a fixed VE of 40% against medically attended illnesses in all flu scenarios, which anticipates a good match between circulating viruses and vaccine strains.
- These are pre-season projections, and hence there is no calibration data on the dynamics of the upcoming epidemic. These projections are primarily based on the historical dynamics of influenza A/H3N2 and A/H1N1 epidemics. As a result, there is high variability in the projected dynamics even within a single model and scenario, which in turn increases uncertainty in projected vaccine benefits. There is also considerable variability between models as regards projected timing and severity of epidemics, in part due to differences in underlying assumptions regarding seasonality and seeding.
- Only 7 participating models contributed national death projections. Together with more limited calibration data available for deaths, our projections for deaths may be somewhat less reliable than for hospitalizations.
- Testing practices continue to evolve in the wake of the COVID-19 pandemic, including increased use of multi-pathogen testing in clinical settings, which may affect reported hospitalizations. This in turn will affect comparison with our projections and with prior year hospitalization data.
Table 1. Flu Scenario Modeling Hub round 1 2023-2024 scenarios. More detailed scenario definitions and model characteristics can be found at https://github.com/midas-network/flu-scenario-modeling-hub.
A Note on Scenario Modeling Hub Round 3 (January 5, 2023)
In Round 3, we produced mid-season projections of influenza in the US, using data up through December 3, 2022. In the four scenarios, we continued to assess the impact of vaccination effectiveness and reduced residual immunity during the 2022-2023 influenza season, a result of reduced transmission of influenza during the COVID-19 pandemic. Ensemble projections are based on contributions from 12 teams (10 nationally) and cover the period from Dec 4, 2022 to June 3, 2023. Scenarios were identical to Round 2, with an additional 3 weeks of calibration data.
Our main findings include:
- In the most pessimistic scenario, with low vaccine effectiveness and pessimistic pre-existing immunity, weekly hospitalizations are projected to peak at 47,800 nationally (50% PI, 33,300-69,800). In this scenario, peak hospitalizations have a substantial likelihood to exceed the peak of the severe 2017-18 season (n = 34,385 hospitalizations).
- Irrespective of scenario, ensemble hospitalizations are projected to peak in mid- to late-December, 2022, though there is variability between states. Some states whose epidemics started later are expected to peak in January.
- Increased vaccine effectiveness is expected to decrease both the peak and cumulative hospitalizations. Higher vaccine effectiveness has a more pronounced effect on the overall burden in the optimistic immunity scenario (likely because the epidemic is projected to occur later, when a larger fraction of the population is effectively immunized). We project that high vaccination effectiveness decreases cumulative hospitalizations by 27.3% in high immunity scenarios, but only by 14.8% in low immunity scenarios.
- There is substantial agreement in the trajectory of individual models in this round.
- At the time of this report, the national trajectory of hospitalizations is declining, falling below the most pessimistic scenario, but still within the other scenarios. It is possible the US has already peaked nationally, though there is substantial variability at the state-level. Additionally, a resurgence remains possible.
- A few caveats are worth
noting:
- The amount of calibration data available for the new HHS influenza dataset remains limited, and testing practices could change between and within seasons. Similarly, the amount of death data available for calibration is limited.
Table 1. Flu Scenario Modeling Hub round 3 scenarios. More detailed scenario definitions and model characteristics can be found at https://github.com/midas-network/flu-scenario-modeling-hub.
A Note on Scenario Modeling Hub Round 2 (December 13, 2022)
In Round 2, we assessed the impact of reduced residual immunity coming into the 2022-2023 influenza season as a result of reduced transmission during the last two influenza seasons because of the COVID-19 pandemic. We also assessed the impact of low versus high vaccine effectiveness. Ensemble projections are based on contributions from 11 teams (9 nationally) and cover the period from Nov 13, 2022 to June 3, 2023.
Our main findings include:
- Under the assumption of 50% reduced immunity at the start of the season, and as compared to the typical level of immunity pre-COVID-19 pandemic, a 40-50% higher hospitalization and death burden is expected based on median national projections.
- Increased vaccine effectiveness is expected to substantially decrease both the peak and cumulative hospitalizations regardless of existing population immunity, reducing hospitalization by 19.5% in low immunity scenarios and by 30.4% in high immunity scenarios.
- In the worst case scenario, with low vaccine effectiveness and low existing immunity, weekly hospitaliza- tions are projected to peak at 38,000 hospitalizations nationally (50% 33,000-46,500). In this scenario, peak hospitalizations have a substantial likelihood to exceed the peak of the severe 2017-18 season. Observed hospitalizations and deaths are most closely tracking with the worst case scenario at the time of this report, though other scenarios remain plausible.
- Irrespective of scenario, ensemble hospitalizations are projected to peak in mid- to late-December, 2022. The worst case scenario of low prior immunity and low VE projects a peak in the week of December 24 nationally (50% PI December 10 - December 31), though there is substantial variability between states.
- There is substantial agreement in the trajectory of individual models in this round.
- A few caveats are worth
noting:
- Some teams had issues calibrating the average pre-season immunity scenarios (A and C), sometimes leading to unrealistically high values of R0 to be consistent with the fast and early rise of the epidemic in the South-East. Further, some teams had trouble making projections for some of the smaller states that had a later epidemic start and lacked informative data for calibration. Recent observations indicate a sharp rise in these states in weeks 46-48. This led us to initiate a third round of influenza projections that will include calibration data until week 48 and will be released later in December.
- The amount of calibration data available for the new HHS influenza dataset remains limited, and testing practices could change between and within seasons. Similarly, the amount of death data available for calibration is limited.
Table 1. Flu Scenario Modeling Hub round 2 scenarios. More detailed scenario definitions and model characteristics can be found at https://github.com/midas-network/flu-scenario-modeling-hub.
Technical report: The uncertain burden of COVID-19 and influenza in the upcoming flu season (October 25, 2022)
The technical report can be downloaded in a pdf format with supplemental plots.
Summary
As the 2022-2023 flu season approaches, there is substantial concern as to the potential for a “twindemic” from the combined influenza season and a new wave of SARS-CoV-2. This heightened concern comes in the context of multiple emerging SARS-CoV-2 variants of concern and the potential for a large influenza season due to limited transmission during the past two seasons. Of particular concern is the potential burden to healthcare facilities, with excessive hospitalizations straining health systems. To better understand what this burden might look like, we combined the ensemble estimates of hospitalizations from the latest rounds of the COVID-19 Scenario Modeling Hub (Round 15) and the Flu Scenario Modeling Hub (Round 1). As of October 25, 2022, all scenarios of COVID-19 Round 15 and the pessimistic immunity scenarios of Flu Round 1 are tracking well with observed hospitalizations from each virus.
Results
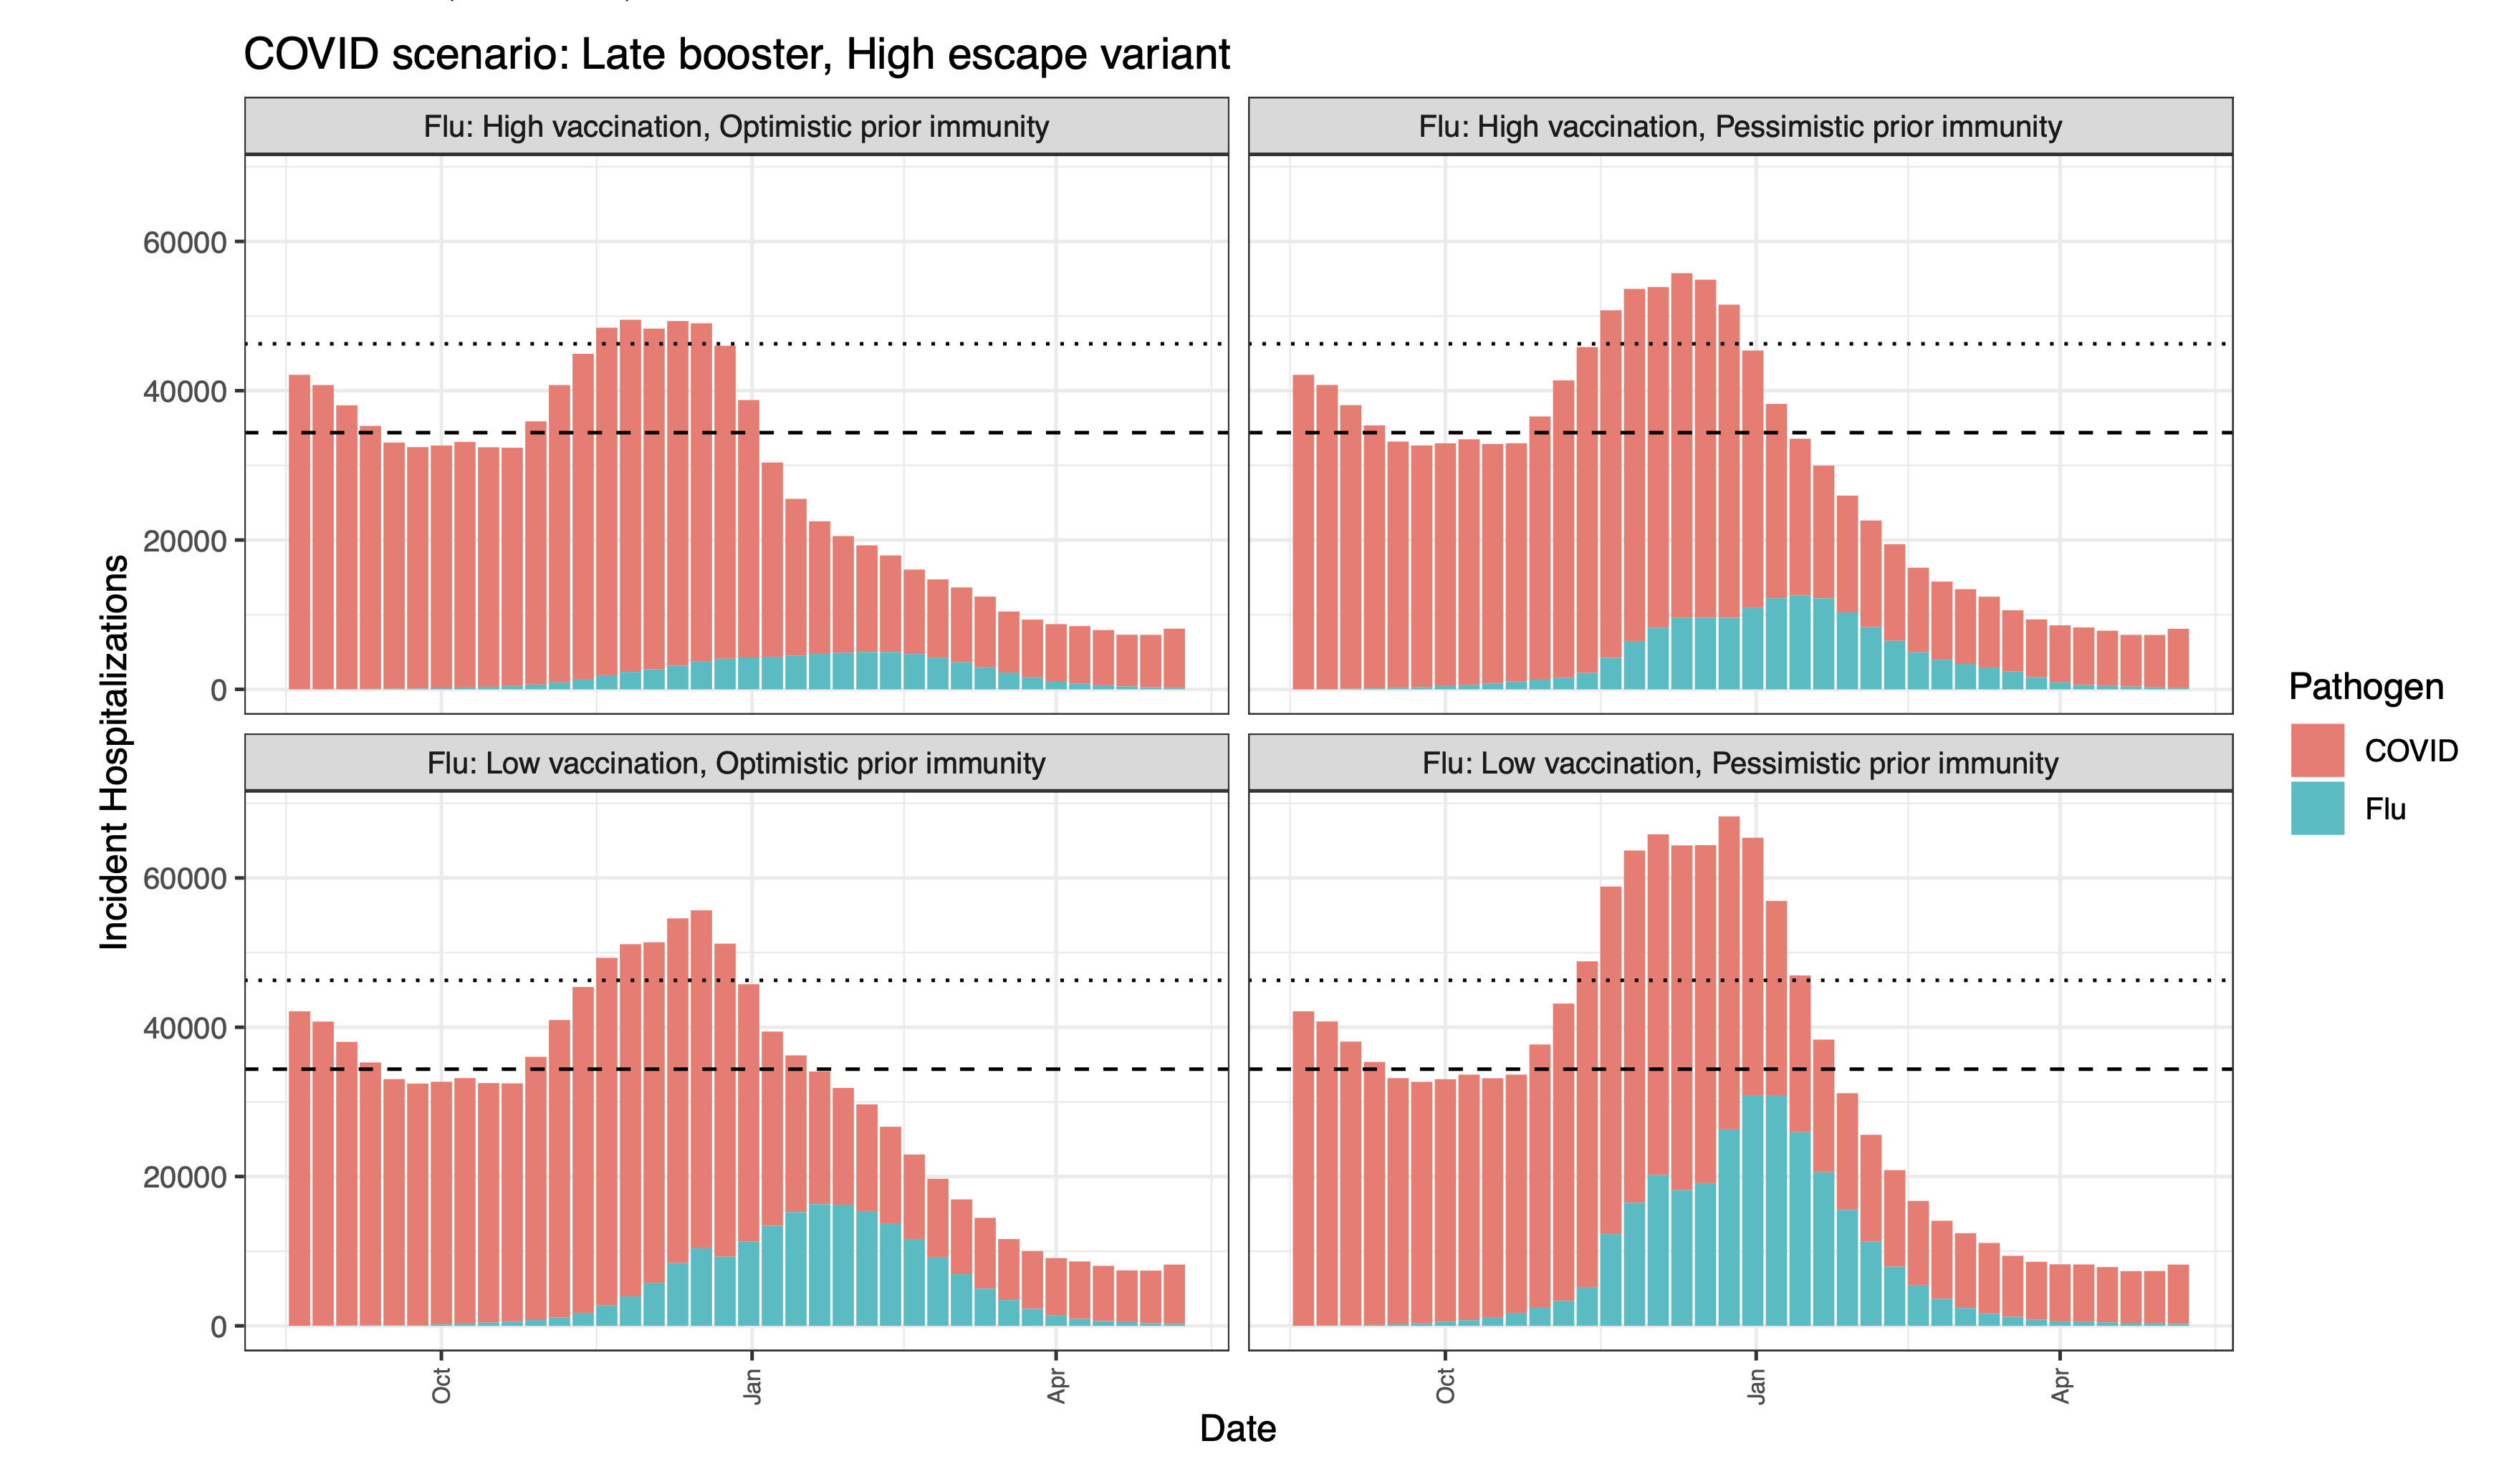
Combining COVID-19 and influenza hospitalization projections, we find that while there is substantial variability among the combinations of the various scenarios, in each combination, we expect to see a substantial burden on the healthcare system. In particular, with the most pessimistic COVID-19 scenario (i.e., a new SARS-CoV-2 variant with late boosters) combined with all scenarios of influenza, hospitalizations are projected to exceed the highest levels of weekly incident hospitalizations observed since the first Omicron surge (n=46,000 in July 2022). In the most pessimistic combination of scenarios, we project 68,000 peak hospitalizations (median ensemble estimates).
In scenarios assuming pessimistic prior immunity to influenza driven by limited transmission during the COVID-19 pandemics, we project large and early influenza seasons. In the most pessimistic influenza scenario in particular, which assumes low 2022-23 vaccination protection, influenza hospitalizations are projected to peak early, during the week of December 17 (50% PI, November 26-January 7), and in the most optimistic scenario where immunity is the highest of all scenarios considered, the influenza ensemble peaks in the week of January 14 (50% PI, December 3-January 28). Given our assumptions about circulation of new COVID-19 variants, a COVID-19 surge is projected to precede an influenza surge. A combined hospital load is projected to peak in December-January.
Caveats and limitations
These projections were produced by combining separate multimodel ensemble projections of COVID-19 and influenza. We do not account for any interaction between COVID-19 and influenza, which could include behavioral or immunological interactions that might modify the impacts of one or both of these viruses. Additionally, these projections were produced without empirical data on either influenza for the 2022-2023 season or on the currently emerging SARS-CoV-2 variants. Despite this, they are tracking well with observed hospitalizations from each virus.
Methods
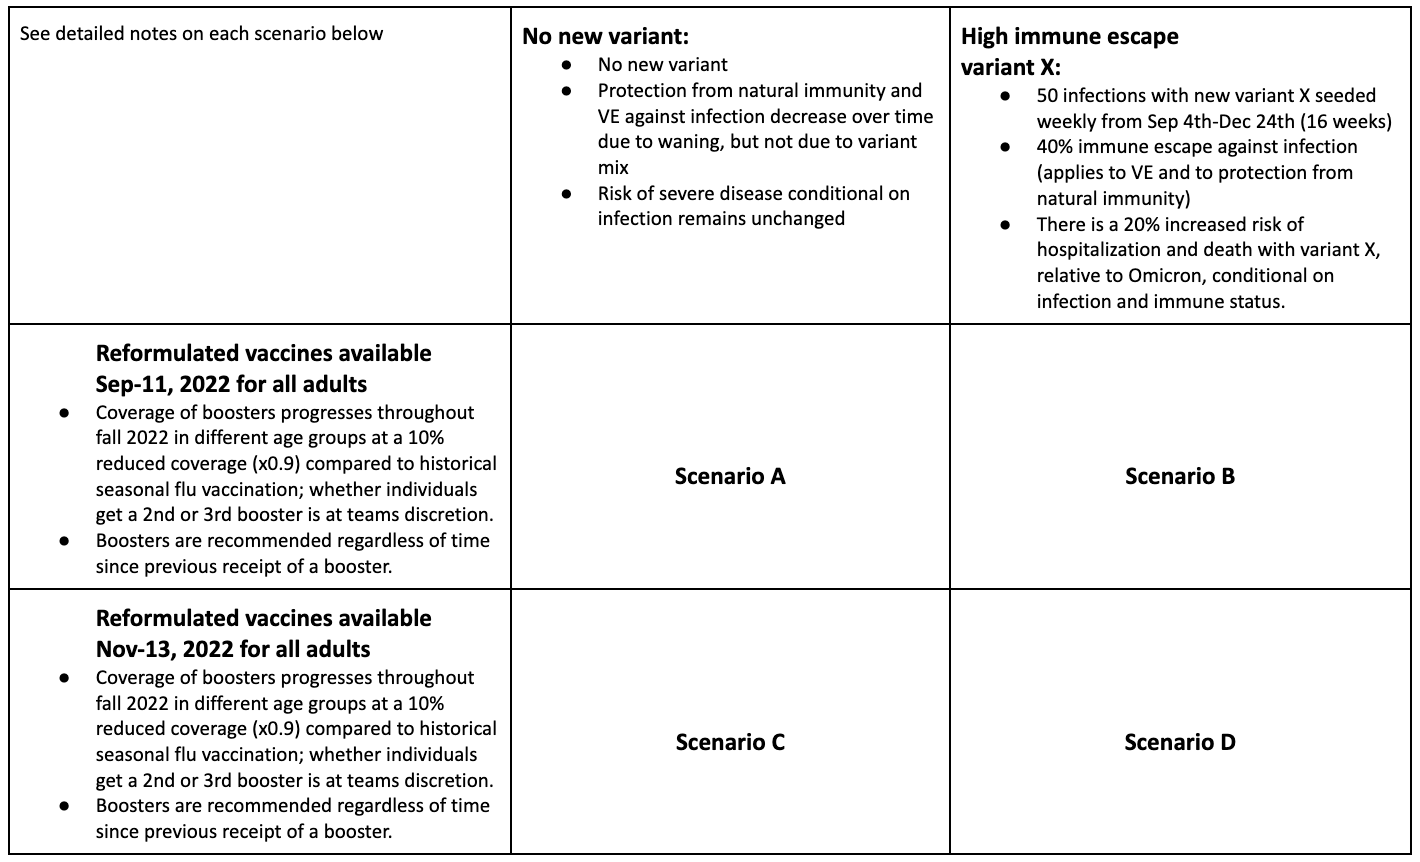
We combined the most recent rounds of COVID-19 (Round 15) and influenza (Round 1) projections. The projection period for COVID-19 Round 15 was July 31, 2022 to May 6, 2023, and the scenario axes considered were the timing of the updated bivalent boosters (available from September 11 in the optimistic scenario versus November 13 in the pessimistic) and the emergence of a new variant of concern (no new variant beyond BA.5 versus an immune escape variant with increased severity emerging in Sept 2022). The projection period for Flu Round 1 was August 14, 2022 to June 3, 2023, and the scenario axes addressed vaccination protection (high or low) and assumptions around prior flu immunity (optimistic or pessimistic, with optimistic representing a typical influenza season and pessimistic being driven by 2 years of limited influenza transmission). The overlapping projection period for the two rounds covered August 14, 2022 to May 6, 2023.
Seven teams contributed scenario projections for COVID-19 Round 15, and ten teams for flu Round 1 scenarios. Ensembles of these scenarios were obtained, and the medians of these ensembles were combined to obtain an aggregate number of incident hospitalizations. We assumed independence of COVID-19 and flu, with no interactions between the pathogens or diseases, or the behaviors toward them.
Ensemble median projections - incident hospitalizations
The dashed horizontal line is the prior peak incident hospitalizations and deaths for influenza, from seasons 2012-13 to 2019-20. These seasons are taken from FluSurv-NET (which is used as a proxy for national hospitalizations). This is from the 2017-18 season. The dotted horizontal line is the highest national COVID peak since the Omicron surge (~46,000).
Round Scenario Specifications
Table 1. Flu Scenario Modeling Hub round 1 scenarios. More detailed scenario definitions and model characteristics can be found at https://github.com/midas-network/flu-scenario-modeling-hub.
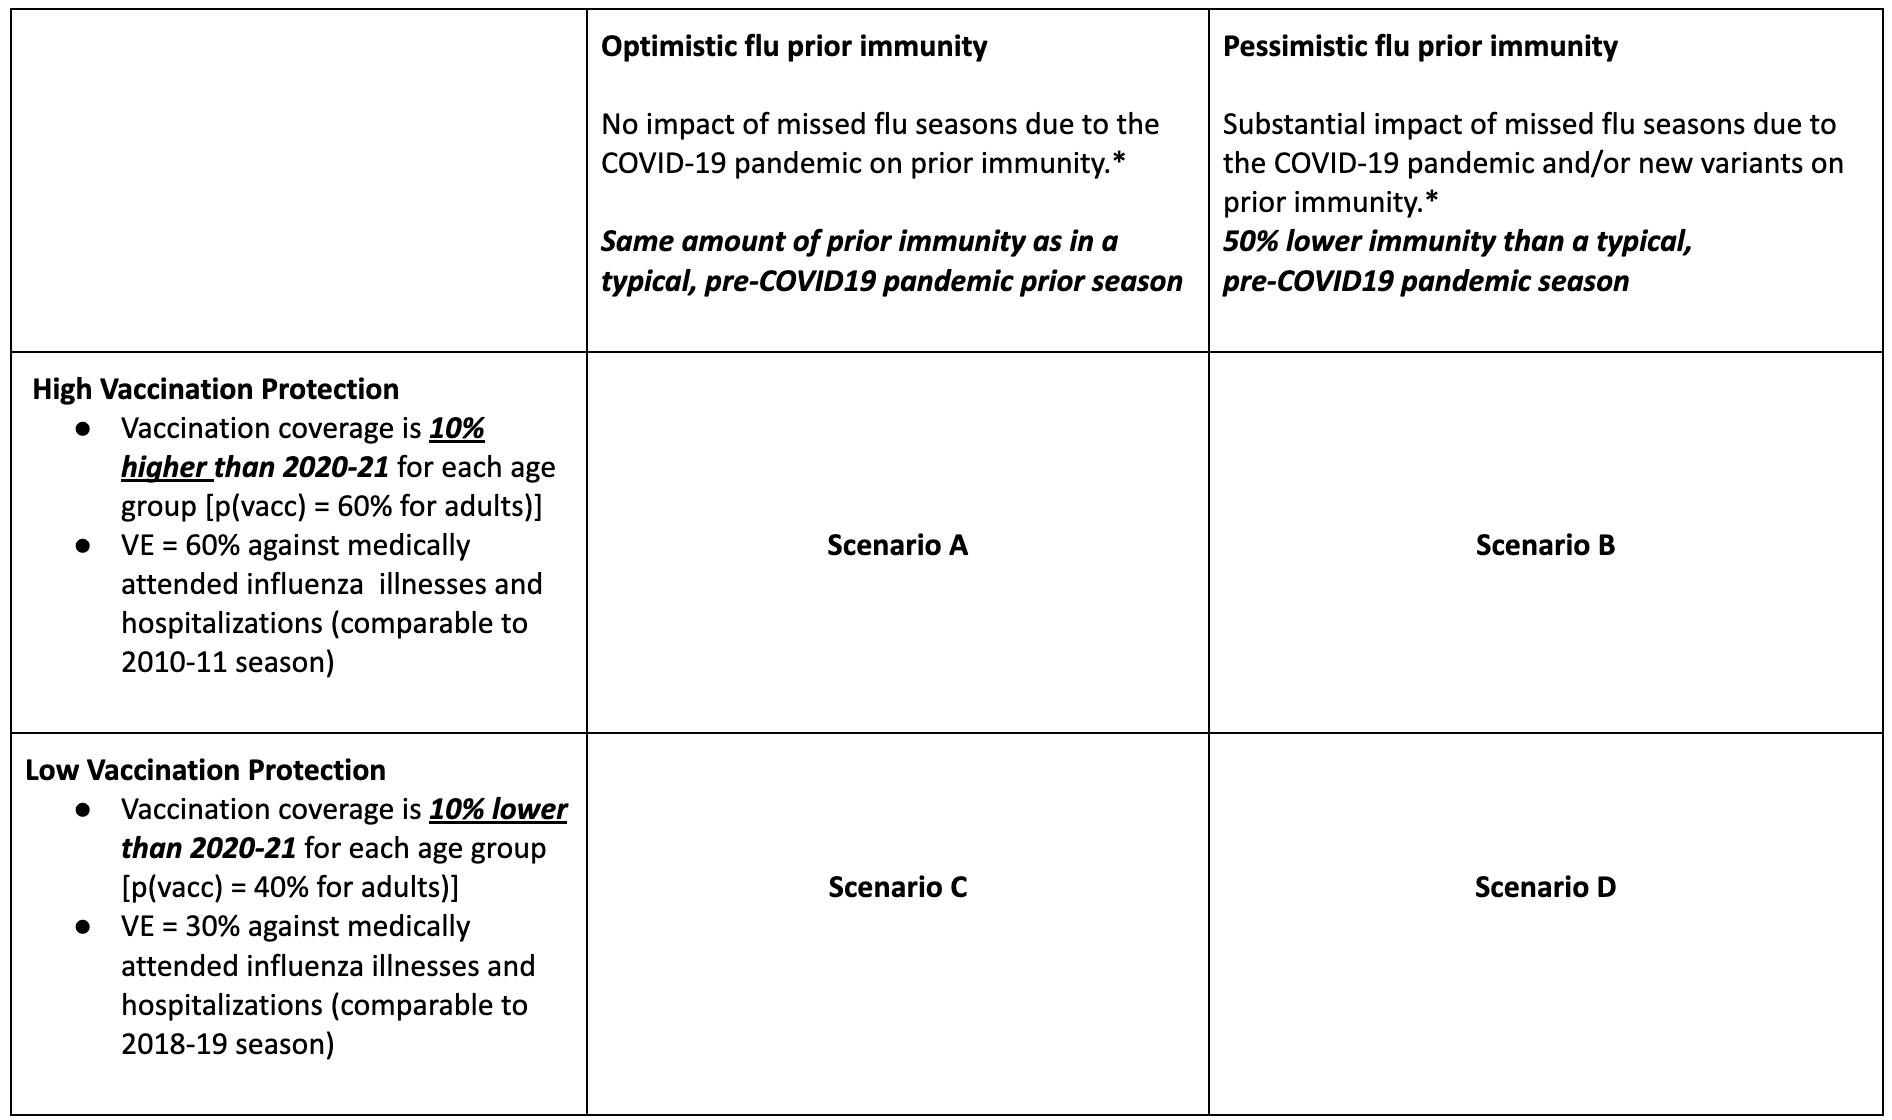
Table 2. COVID-19 Scenario Modeling Hub round 15 scenarios. More detailed scenario definitions and model characteristics can be found at https://github.com/midas-network/covid19-scenario-modeling-hub.
A Note on Scenario Modeling Hub Round 1 (September 29, 2022)
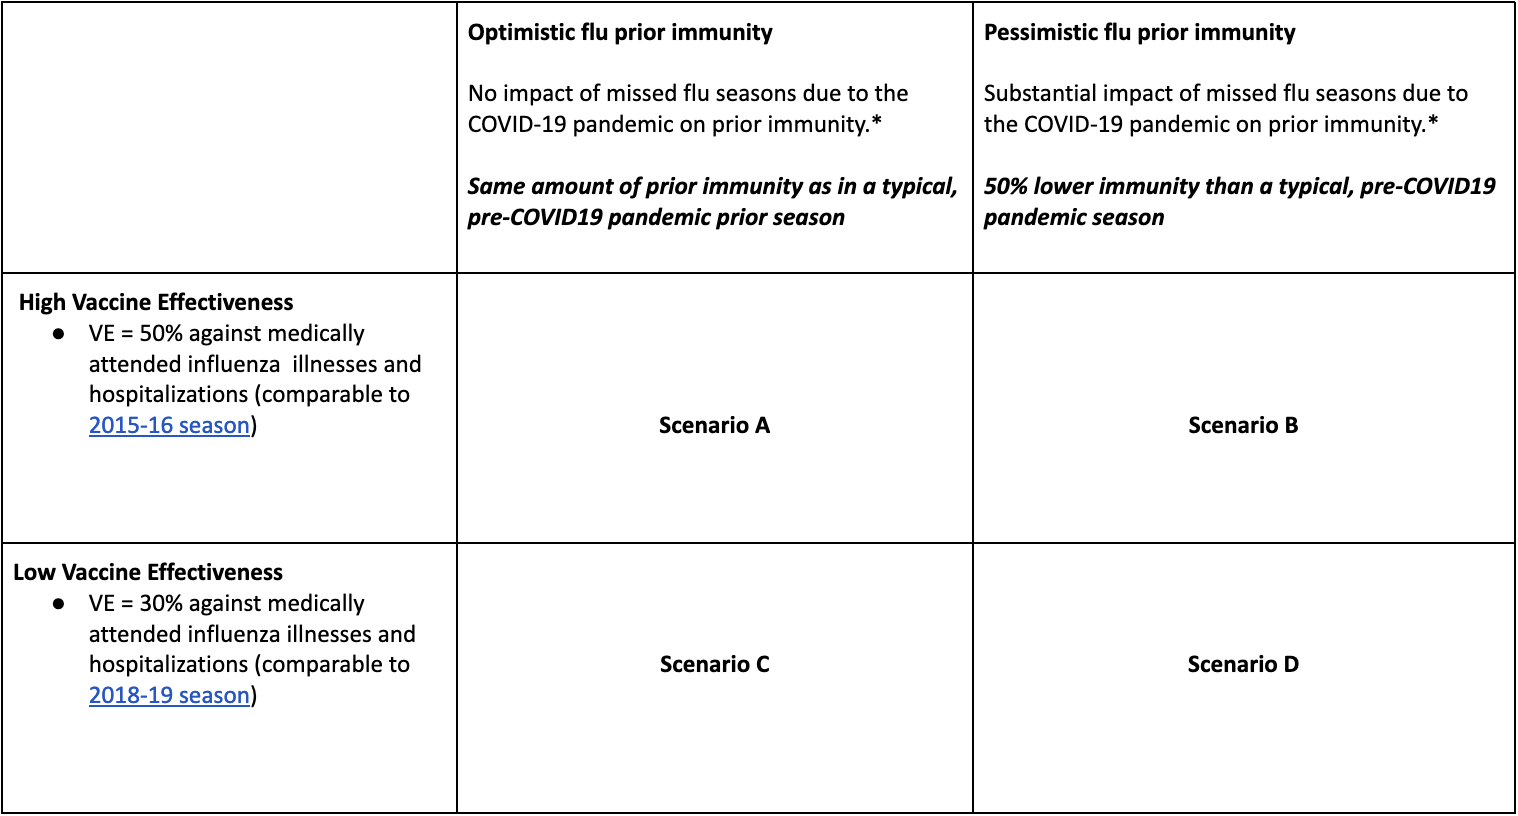
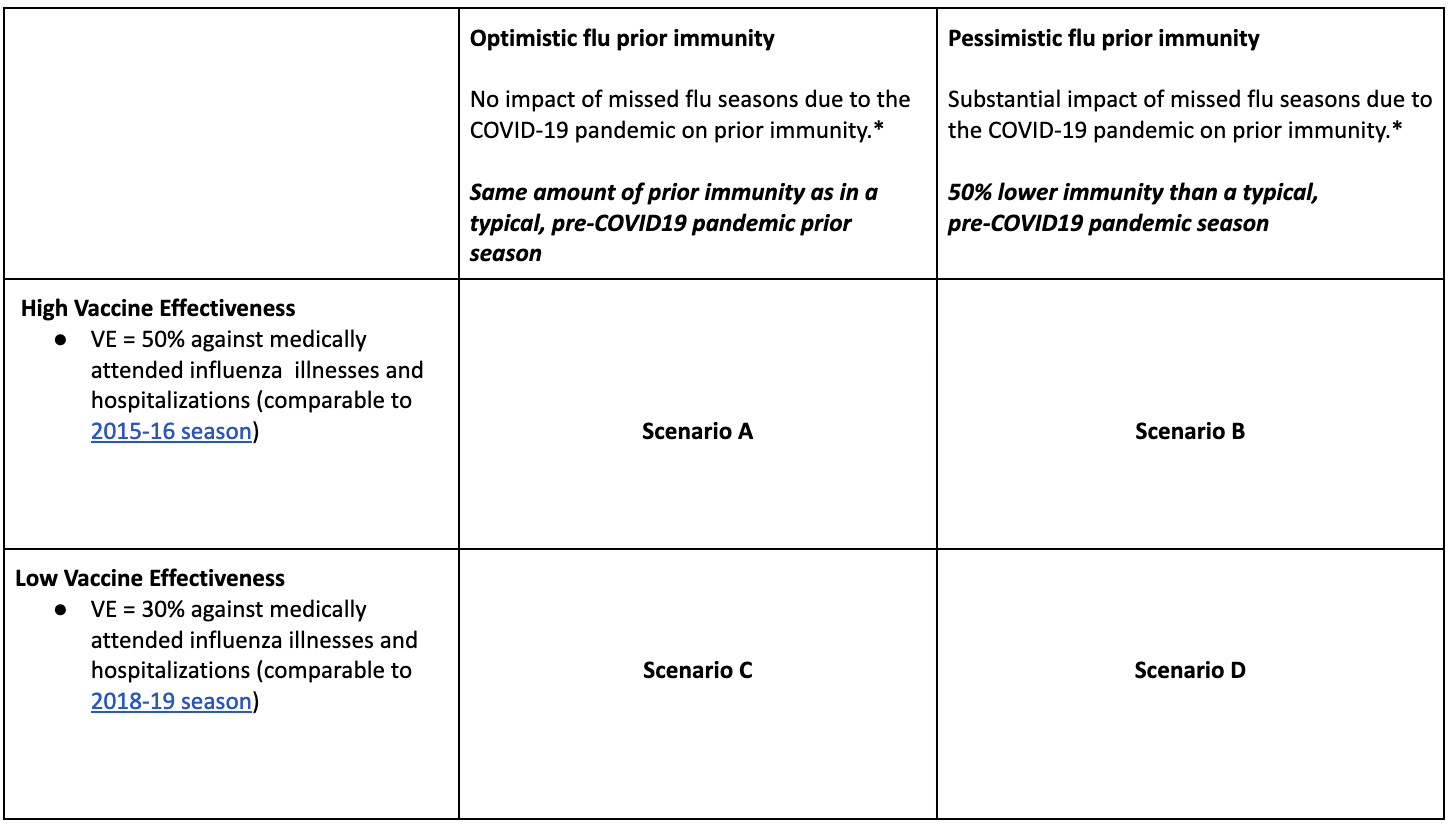
A consortium of ten modeling groups convened to generate long-term scenario projections of hospitalizations and deaths that cover the period of 10 months from Aug 14, 2022 to June 3, 2023, across four scenarios. In this first round of influenza projections, we assessed the impact of reduced prior population immunity coming into the 2022-2023 influenza season as a result of decreased influenza circulation during the COVID-19 pandemic. We also assess the impact of low versus high vaccine-induced immunity (vaccine effectiveness combined with vaccination coverage)
Our main findings include:
- There is large variability in the projected burden of the 2022-23 epidemic depending on vaccine and prior immunity assumptions; yet the 50% projection intervals of all scenarios support a larger cumulative burden this season compared to the 2021-22 winter and the lowest previous pre-pandemic season (2015-2016 season).
- In the worst case scenario D, weekly hospitalizations are projected to peak at or above the highest pre-COVID-19 season (2017-2018), with an ensemble median of 35,800 nationally (50% PI, 17,300-53,400). In the best case scenario A, this is significantly reduced to 7,500 (50% PI, 4,900-17,800), which is still 2.1-fold higher than in the 2021-22 season.
- With a large immunity gap due to COVID-19 (pessimistic immunity scenarios), hospitalizations are projected to be 27%-89% higher than with a typical level of immunity in the pre-COVID-19 period (optimistic immunity scenarios; range of ensemble medians across vaccine assumptions).
- Increased vaccine effectiveness and coverage is expected to substantially decrease peak and cumulative hospitalizations regardless of existing population immunity, reducing hospitalizations by 45% in low prior immunity scenarios (representing around 165,000 hospitalizations averted) and 67% in high prior immunity scenarios (representing around 187,000 hospitalizations averted). Cumulative deaths would be reduced by around 67% and 76%, or 32,000 and 17,000 deaths averted, respectively.
- In scenario D, where immunity from prior seasons and 2022-23 vaccination is at its lowest, ensemble hospitalizations are projected to peak in the week of December 17 (50% PI, November 26-January 7). In scenario A, where immunity is the highest of all scenarios considered, the ensemble peaks in the week of January 14 (50% PI, December 3-January 28).
- A few caveats are worth noting:
- There is substantial uncertainty in this first round of influenza projections due to lack of complete historical surveillance data from prior seasons. Further, the transmissibility of influenza strain(s) circulating in the 2022-23 season in the US is still unknown. As the season starts this uncertainty should reduce
- There is also uncertainty in the amount of influenza reporting in the coming months as testing practices for respiratory viruses have changed during the COVID-19 pandemic.
- The trajectories of individual models are asynchronous, likely due to differences in seasonality assumptions, among others. This flattens the ensemble median and 50% PI for incident hospitalizations and deaths. Ensemble estimates of the peak size and cumulative burden are less affected by differences in the timing of individual models and are considered a more reliable indicator of the potential impact of the 2022-23 season than the trajectory ensembles.
- Scenarios did not consider immunological interactions with SARS-CoV-2 or reactive behavior changes and interventions in response to a new SARS-CoV-2 variant that may arise in the 2022-23 respiratory virus season, either of which could affect the transmission and disease burden of influenza.
- These hospitalization projections represent the expected number of influenza hospitalizations reported to the HHS system. These are not meant to reflect the final CDC estimates from the pyramid approach, which takes into account underreporting and various delays.
- The most pessimistic assumed vaccine effectiveness in these scenarios was VE=30% against hospitalization. It should be noted that recent seasons have had substantially lower estimated seasonal VE (e.g., 2014-15 with VE=19% overall), thus a substantial mis-match of the vaccine to circulating influenza strains could drive higher transmission than these scenarios.
- These projections were made with a data cutoff of August 14, 2022; no data after that day was to be used to calibrate or otherwise inform the model.
Table 1. Flu Scenario Modeling Hub round 1 scenarios. More detailed scenario definitions and model characteristics can be found at https://github.com/midas-network/flu-scenario-modeling-hub.